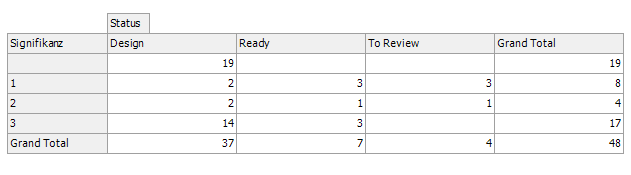
Pivot tables visualize multi-dimensional data
• Columns and rows can be freely configured
• Like diagrams, pivot tables are separately connected to the underlying data
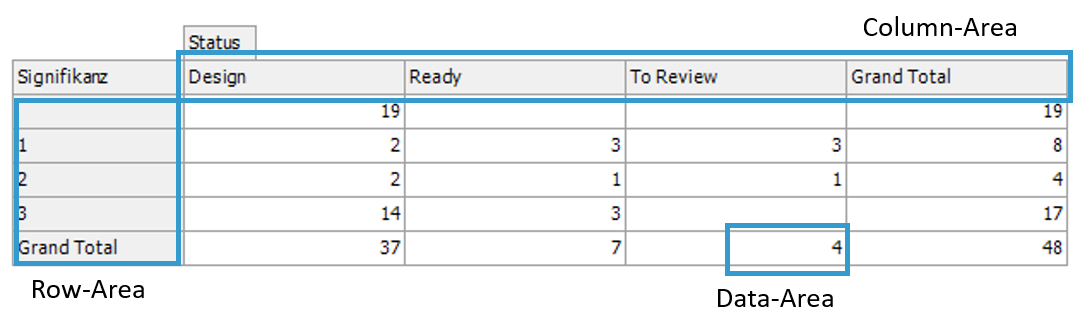
•A „Row-Area“ field that is configured on Significance shows all the element‘s significances as rows
•A „Column-Area“ field that is configured on Status shows all statuses as columns
•A „Data-Area“ field that is configured on the number of elements shows the corresponding number of elements from the significance-status-pairs