Diagrams are charts which are based on the data available in the report. Here, you need to be careful because even if a diagram is put into a band, the data used in this diagram is taken from the entire report.
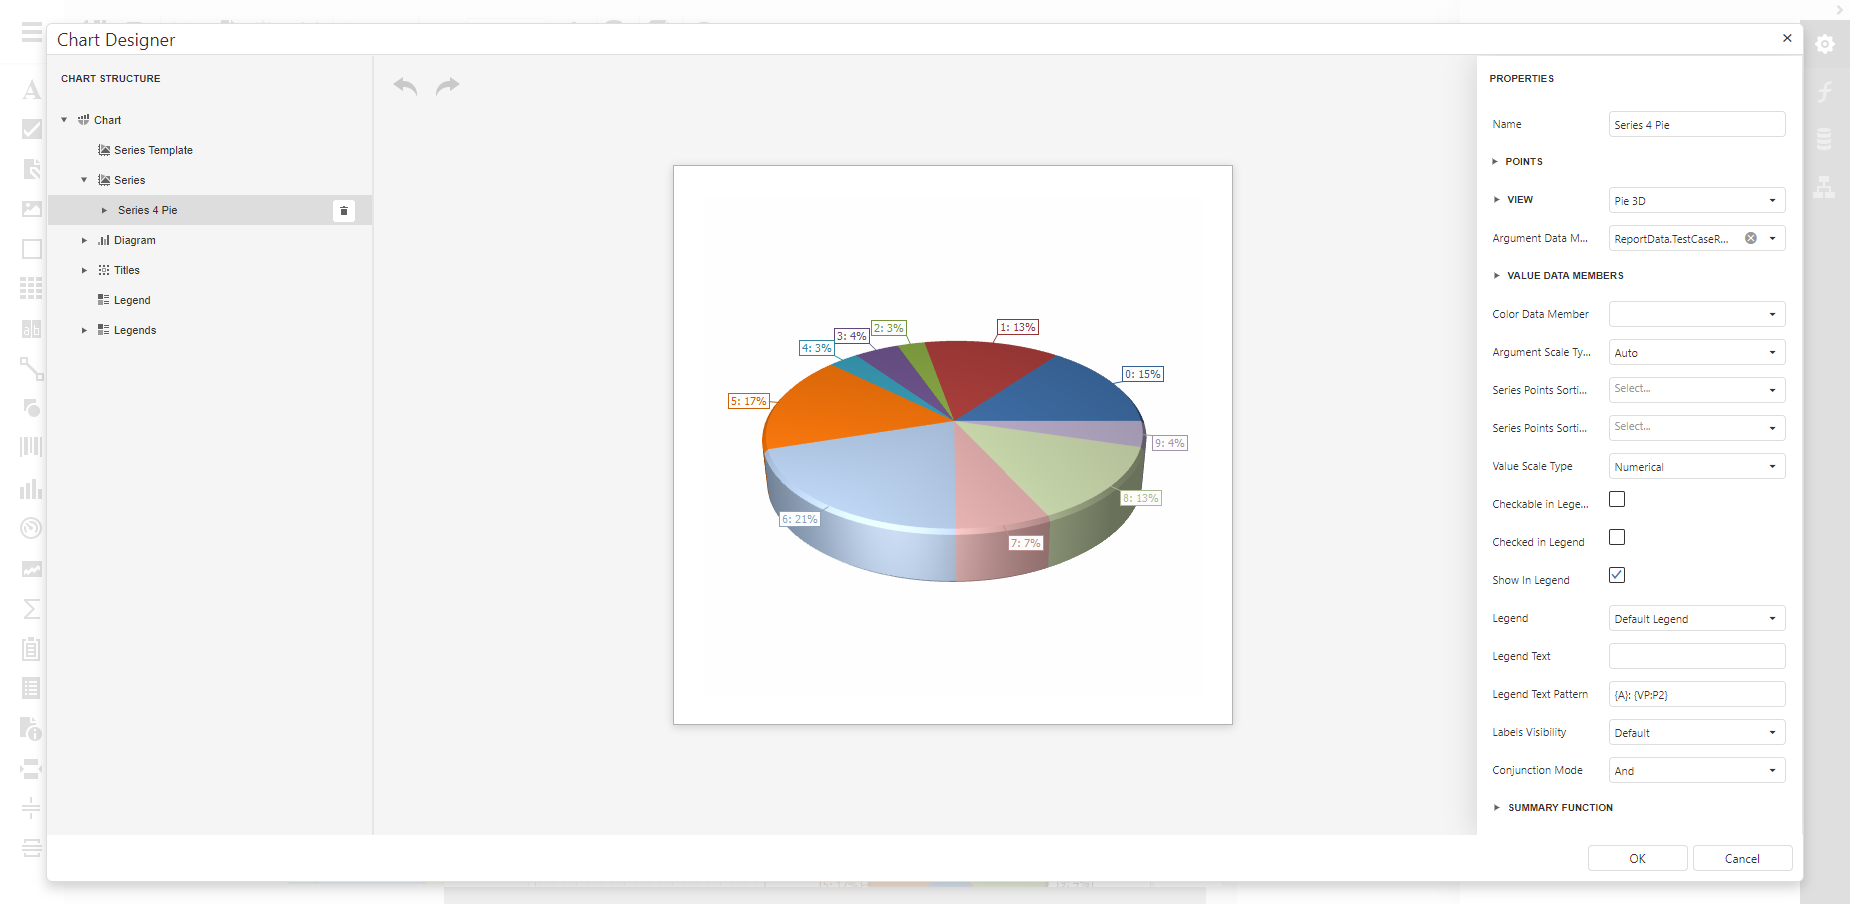
To create a diagram, add a chart to your layout and click on 'Run Designer'. Here, you can define via series, arguments and properties how the chart should look like.
• The connection of data with diagrams is established with rows
• Every row contains a grouping argument (x-axis) and a value (y-axis) which is normally calculated with a sum function
• For the use of 2D diagrams, you can define several rows.