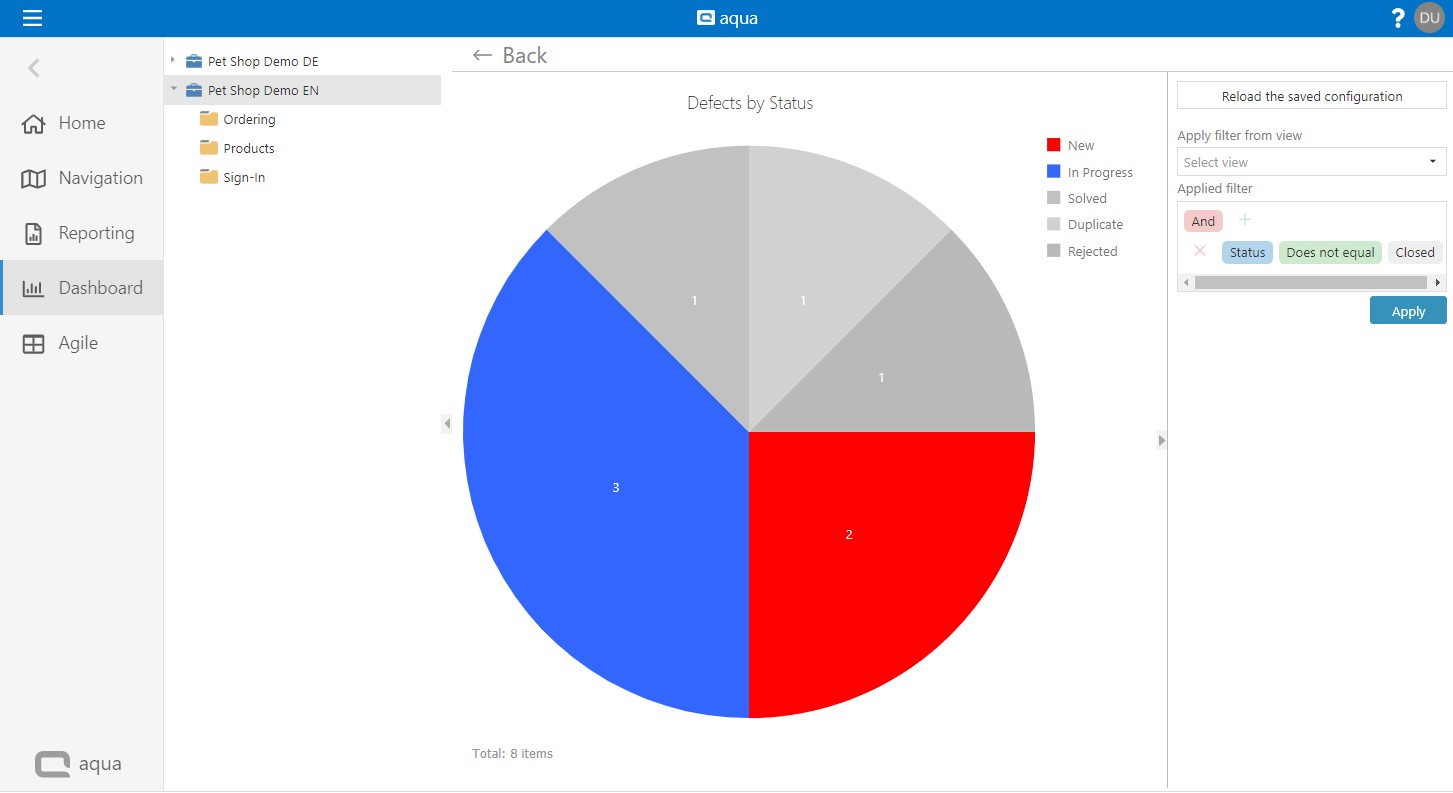
For a deeper analysis of a single chart, maximize it. You can do this either by clicking the maximize button or simply by clicking inside the widget. Now you will see your aqua project tree on the left side and a filter selection on the right side. This way you can easily apply the widget to other projects or subfolders or further narrow the widget's data using filters or views. This has no effect on the configuration of the widget itself and can be reset by clicking on Reload the saved configuration or when returning to the dashboard.
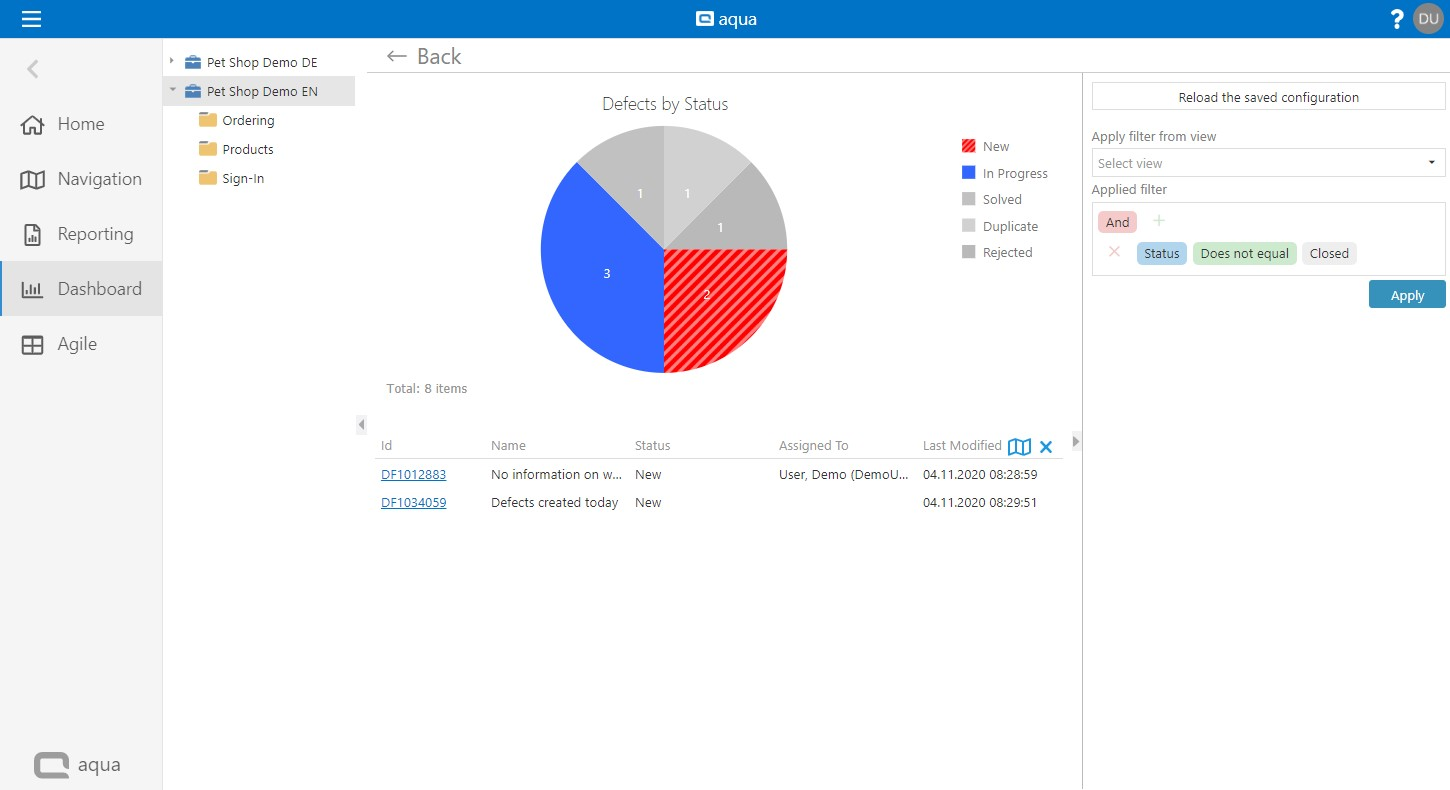
By clicking into the widget itself, the items from the selected grouping of the widget are displayed below the widget (e.g. all defects in the status "New"). A click on the ID opens the respective item directly and the button opens all the items from the selected grouping in the item browser of the navigation.