Layout Designer
The layout designer features a drag and drop interface where you can add labels or pictures to your report or manipulate the design properties of items. These labels can be edited and the properties can also be changed using scripts, if wanted.
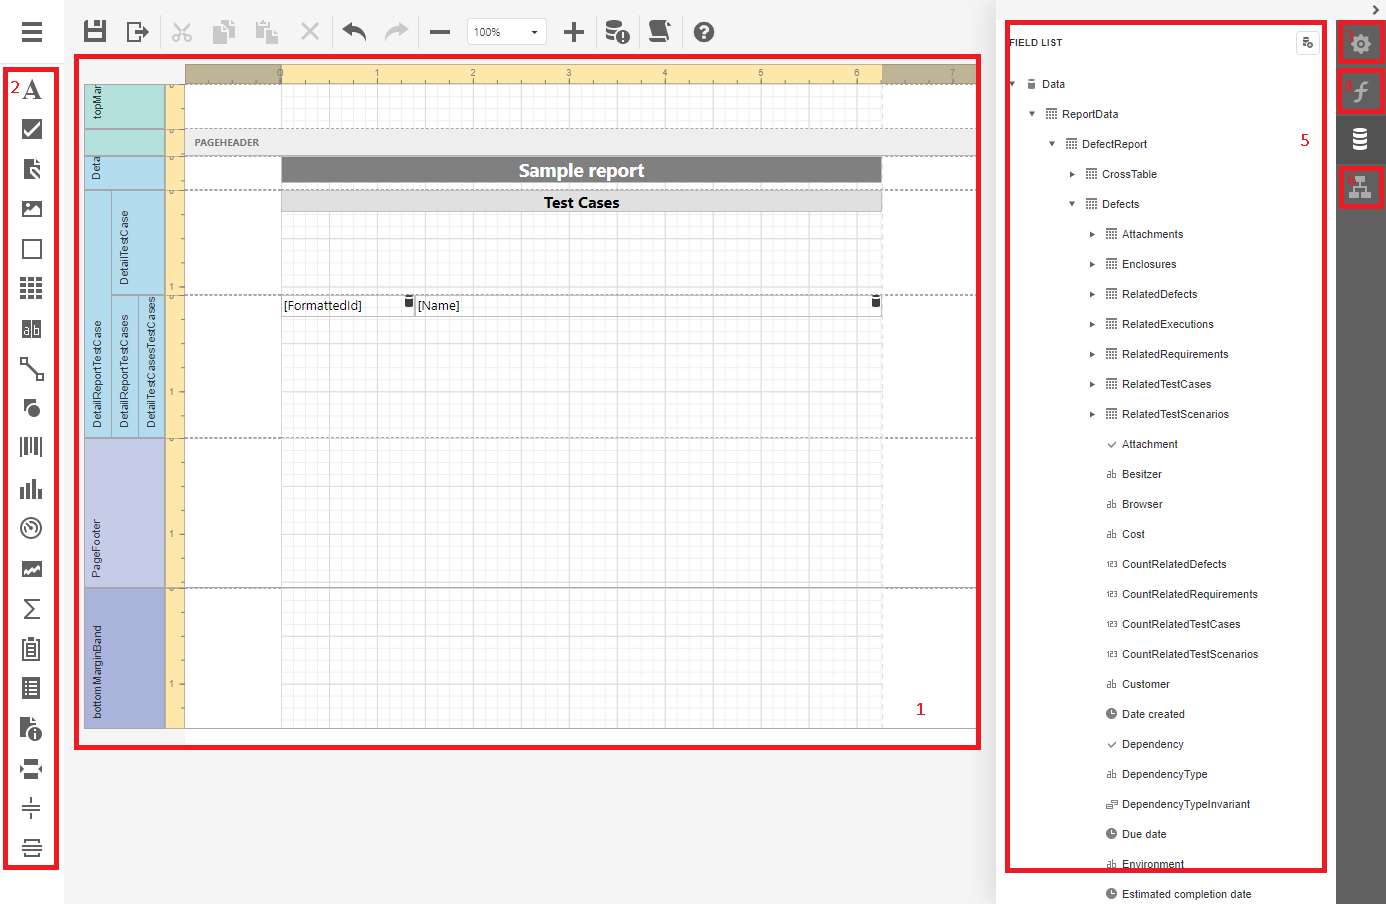
The basic layout of the layout designer consists of a report design field (1), a toolbar on the left (2), properties (3), expressions (4) and a basic element tree of the data structure in aqua (5) as well as an element tree of the report (6) on the right.
The toolbar on the left can be used to drag and drop new elements into the report design field, i.e. labels, pictures, or diagrams. The property band on the right enables you to easily manipulate the design of an element and to add some script functionality on an event the element throws during the creation of the report. With expressions, you can define short snippets for fields, e.g. to manipulate strings or colors when specific conditions are true. The element tree of the aqua project on the right can be used to bind a label to a particular element. The text value of the label is then set to the value of the element. The element tree of the report is intended to be used for better orientation within the report.
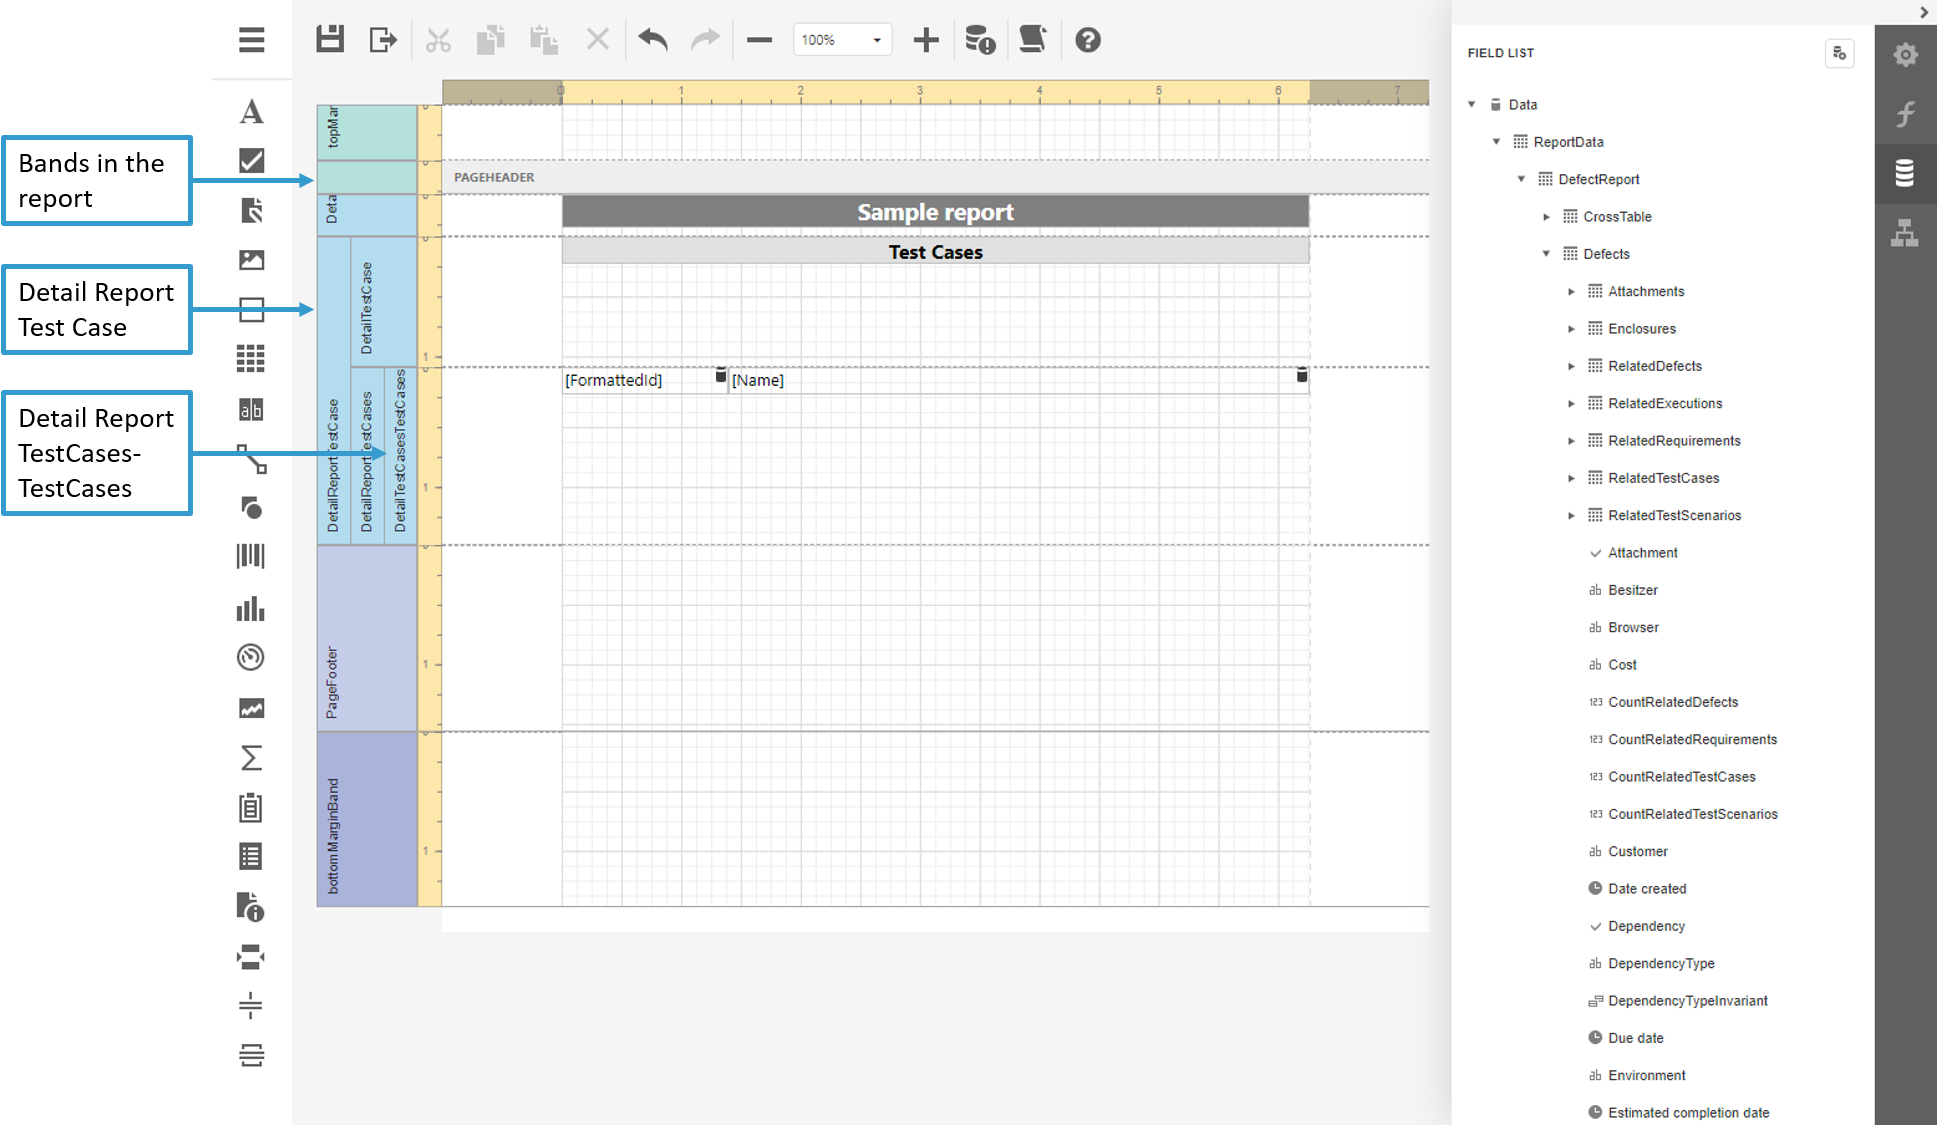
Bands
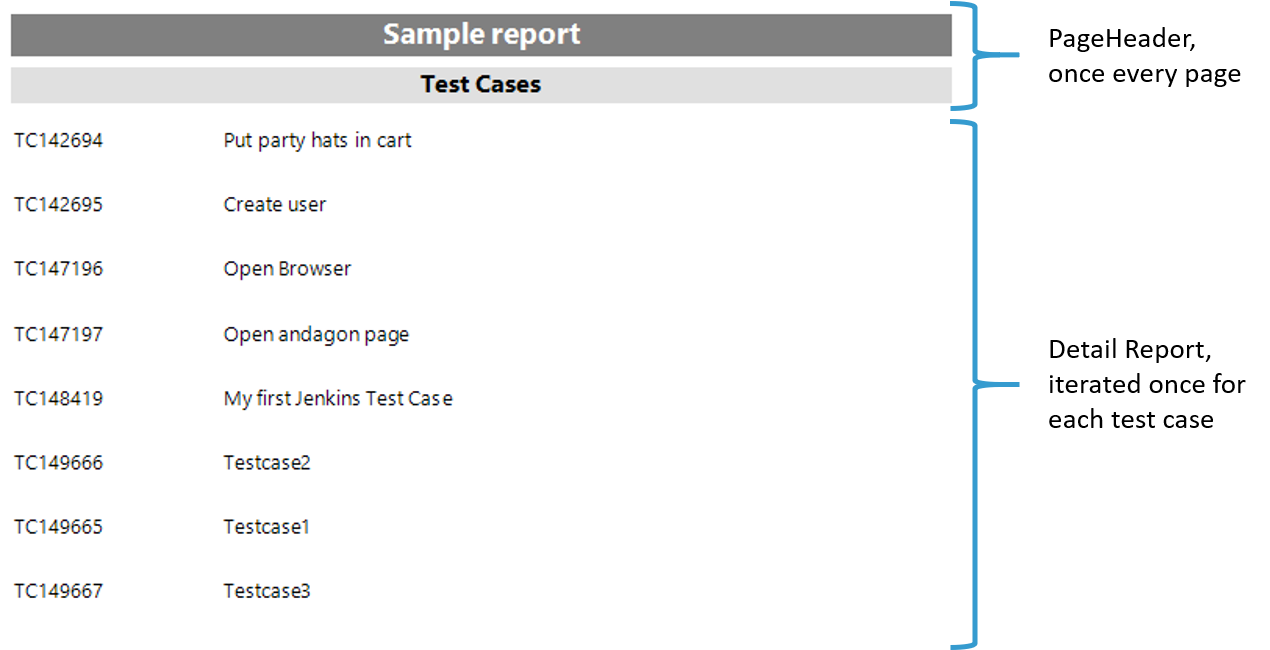
Bands are sections that can be bound to some data pools and then the bands are printed once for each item in the data pool. In aqua, this data pool might for example only consist of test cases within the selected project folder / subfolder.
Within one band a detail report can be added. For test cases, a detail report might be bound to all related requirements, for example. Then, when the report is printed for each test case, it will iterate over all related requirements of this test case before printing the next test case and its related requirements.
Typical bands within a report are:
• PageHeader
• ReportHeader
• PageFooter
• ReportFooter
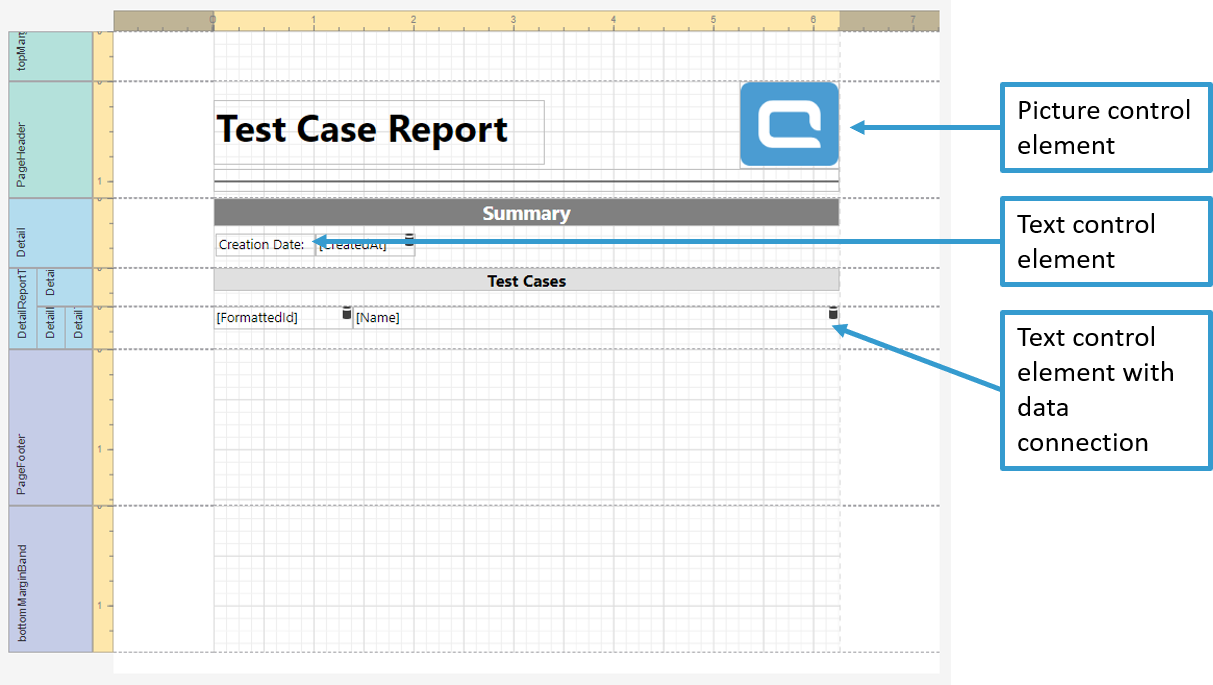
Control elements
Control elements are all layout elements within a report, like a label, a picture, a diagram, a pivot table, lines, figures, frames, etc..
These elements can be bound to a certain tree element value of the report. For example, if I bind a label to the name value from the test case report, then the text value of this label is set to the name of the currently processed test case for each band iteration.
During the creation of the report, these control elements throw different events, for example before or after print events. When these events are thrown by the element, you can define a script method which will then be executed. This practice is available for each control element type, i.e for diagrams as well as labels.