Burn Down Chart (Rich Client)
As you can see, this is a burn down chart which tracks the actual progress of your development tasks. If an element has a Defintion Of Done status, you will perceive that the progress is going down point by point.
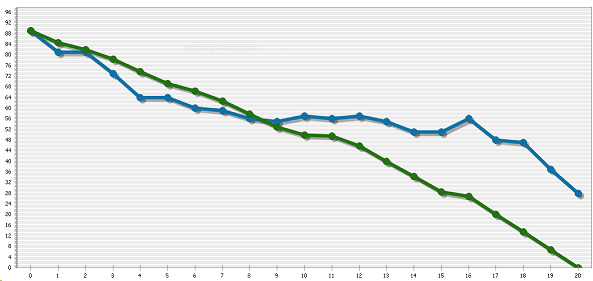
The green line is the optimal line giving you an overview if your progress (the blue line) is just in time.